
Claude API OpenTelemetry export: what the spans hold and how to count them
Anthropic's API can now send OpenTelemetry spans to your own backend. What the content modes capture, how delivery works, and why token counts need care.
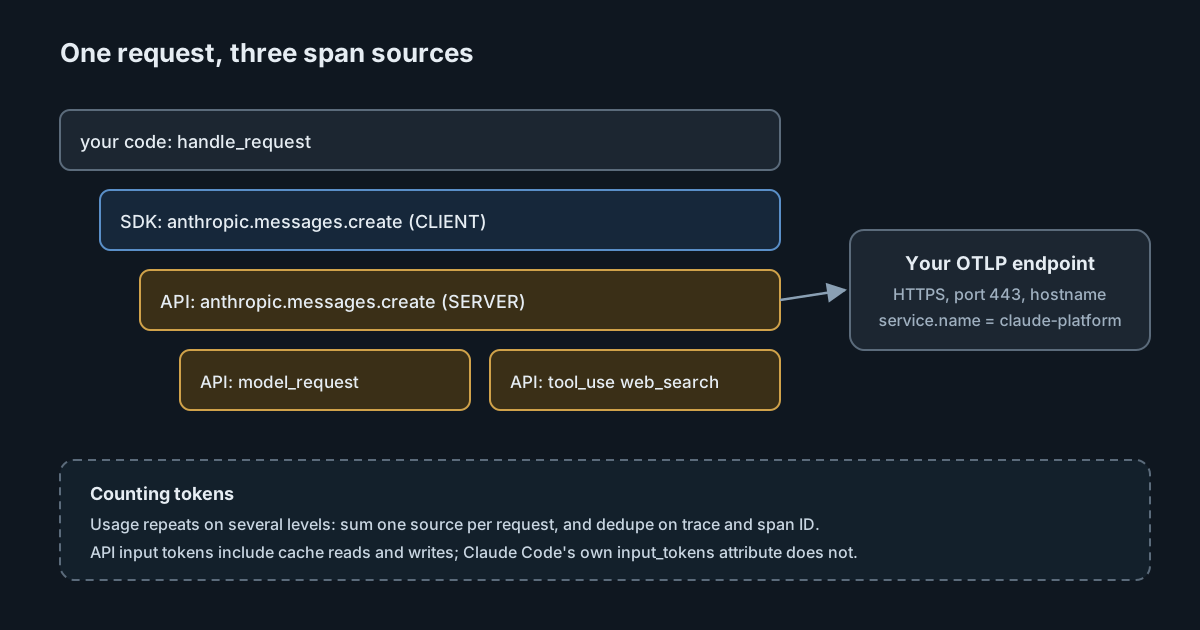
Until now, a team that wanted to see inside a Claude API request had to instrument its own client and guess at what happened on the provider's side. On 14 October 2026 Anthropic put OpenTelemetry export into beta: the API itself can emit spans for each model request and each tool use it runs, and send them to an observability backend you choose. That is useful, and it also creates a new data flow, with its own privacy, cost and counting questions. This article covers what the export contains and the details that are easy to get wrong.
What was released
The release notes describe two parts. The Claude SDK emits spans in Python, TypeScript, C#, Go, Java, PHP and Ruby. Separately, the API emits spans for Messages API requests and Claude Managed Agents sessions once an administrator adds an OpenTelemetry destination in the Console. The overview page says the spans use the GenAI semantic conventions, so platforms that understand those conventions can read them without extra setup.
The two parts see different things. SDK spans cover clients that use the SDK, including tools that the SDK's tool runner runs on your side. API spans cover any client, including requests sent with plain HTTP, and show what the API did inside a request: each model run, and server tools such as web search. Set up both and a request's SDK span contains its API span, inside your own application's trace.
Two content modes, and who stores what
Each destination and each SDK client has a content mode:
- Metadata only is the default. Spans include identifiers, timing, status, token counts and text you chose yourself, such as tool and agent names and MCP server names.
- Full content adds the prompts and responses, including the system prompt and tool arguments and results.
The overview is direct about the consequence: your observability platform "stores this content under its own access and retention settings". Turning on Full content copies every prompt and completion into a second system, with its own staff access, retention and region. We wrote about that choice in capturing prompts in AI telemetry. The same reasoning applies here.
Two details are worth knowing before you decide:
- If your organisation has a HIPAA, FERPA or K-12 data-handling restriction with Anthropic, API destinations export only metadata whatever their content mode. SDK spans are not affected, so the SDK setting still needs care.
- Zero data retention still allows Full content for Messages API requests: the API holds the exported content only in memory until delivery. The docs exclude models that have their own data retention requirements. Managed Agents is not eligible for zero data retention, and the docs say its retention is unchanged by OpenTelemetry.
Full content is also capped. By default a custom destination's spans hold up to 0.75 MB of content each (for a partner platform, the Console sets a limit that platform accepts), which the docs say fits a 200k-token context of English text. A full 1M-token context needs about 4 MB. Content over the limit is shortened, with anthropic.content.truncated set to true. Request spans drop the system prompt and the earliest messages first. If you plan to build evaluations from traces, check that flag.
Setting up a destination
The API tracing guide sets some firm requirements:
- Organisation admins add and change destinations. The developer role can view them, and a developer who is also a Workspace Admin can add that workspace to a destination or remove it. On Claude Platform on AWS, your IAM policy decides who can manage destinations.
- The endpoint must accept OTLP/HTTP with protobuf encoding at an HTTPS URL on port 443, with a hostname rather than an IP address. A self-run OpenTelemetry Collector listens on port 4318 by default, so it needs reconfiguring or a load balancer in front.
- Each destination covers All workspaces, Selected workspaces, or All except a list. An organisation can have up to 10 destinations, counting disabled ones.
- Spans arrive with
service.name = claude-platform.
The endpoint has to be reachable from the internet, so a collector that receives provider telemetry is a new public entry point. Give it its own credentials (the request headers you configure are not shown again after saving) and accept only the signals you expect.
Delivery is best effort
The delivery rules affect how far you can rely on the data:
- At least once. A span can arrive more than once. Deduplicate on trace ID and span ID.
- Best effort. A span can be lost, and a lost span is not sent again.
- Disabling. The API disables a destination if the endpoint answers with a 3xx redirect, or if all deliveries fail for 24 hours. Spans for a disabled destination are dropped, not queued.
- Timeouts. The endpoint must complete the TLS handshake within 5 seconds and send response headers within 5 seconds, with 10 seconds in total per delivery.
A redirect introduced by a load balancer change is enough to stop export. The Console marks the destination as Disabled, but only for someone who looks, so add an alert for missing claude-platform spans as well.
Connecting traces, including MCP servers
The API reads the W3C traceparent header on each request. If the header's sampled flag is off, the API emits nothing for that request. That is useful for controlling volume, and it also means a client can opt its requests out of provider-side tracing.
The guide adds one feature that matters for teams running MCP servers. When a server is connected through the Messages API's MCP connector or the Managed Agents MCP connector, the API sends a traceparent in params._meta of each tools/call request. Your MCP server can then put its own spans under the API's tool-use span, so a slow or failing tool shows up in the same trace as the model request that called it.
Counting tokens without double counting
This is where most dashboards will go wrong. Usage appears on several spans for one request: on the SDK client span, on the API server span and on each model run inside it. The overview says to sum one source per request. For a Messages API request, use either the anthropic.messages.create spans or their anthropic.model_request spans, not both, and add the anthropic.compaction spans if the request had compactions (not the compaction attributes on the request span as well, which hold the same tokens). For a Managed Agents session, sum the anthropic.model_request and anthropic.session.outcome_evaluation spans.
There is also a definition difference between products. In these spans, the docs say, gen_ai.usage.input_tokens "already includes the tokens read from and written to the prompt cache". In Claude Code's own telemetry, the monitoring reference defines its input_tokens attribute as excluding cache reads and writes, which it reports separately. A dashboard that adds cache tokens to API spans counts them twice. A dashboard that treats both sources' input tokens as the same measure compares different things. Our overview of OpenTelemetry for AI coding tools covers more of these differences between tools.
Finally, the docs say plainly that exported spans "aren't guaranteed to be a complete record of your API usage". To track each API key's usage, for example to spot a leaked key, they point to the Usage API instead, which also counts requests without spans.
What it means for engineering and security leaders
- Provider-side traces close a visibility gap, especially for server tools and Managed Agents turns, which your own client cannot see.
- Full content is a data transfer decision. Treat it like adding a new processor of prompt data: review the backend's retention, access and region first.
- Spans are for debugging and trends, not billing. Reconcile costs against the Usage API.
- Ownership matters. Destinations are an organisation-level setting that admins control, with workspace admins able to add or remove their own workspace, so agree who owns them and how changes are reviewed.
Practical takeaways
- Start with Metadata only and one Selected workspace, then widen.
- Put the collector behind HTTPS on port 443 with its own credentials, and alert when
claude-platformspans stop arriving. - Deduplicate on trace and span ID, and sum tokens from one source per request.
- Do not mix cache-inclusive and cache-exclusive input token figures in one chart.
- Check
anthropic.content.truncatedbefore using traces for evaluations. - If you run MCP servers behind the connector, read
traceparentfromparams._metaand emit child spans.
For the coding tools themselves, SpanDock receives the OpenTelemetry that tools such as Claude Code send and can forward it to Langfuse, Grafana Cloud, New Relic or a generic OTLP endpoint, as the destinations page describes, so tool telemetry can land in the same backend as these API spans. Forwarding to more than one destination is part of the Standard plan and above. Personal includes one destination.