
Copilot usage metrics now name your own skills and count tools like OpenCode
Two October changes to GitHub's Copilot usage metrics API: named custom skills, agents and MCP servers, and a per-client view of model traffic.
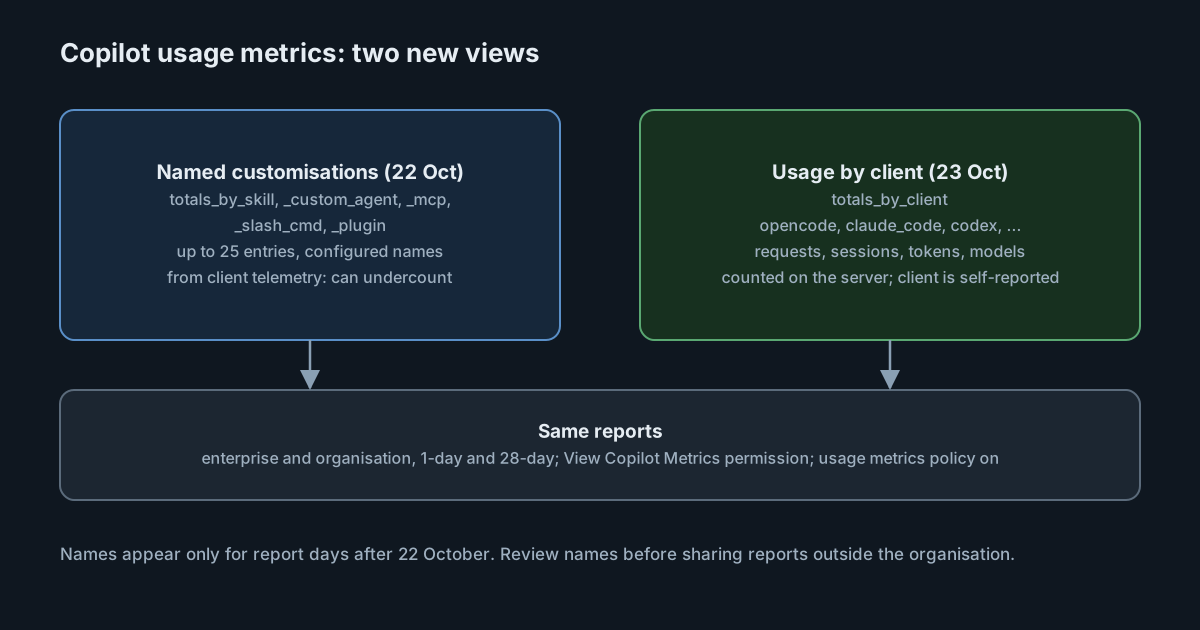
Two changes to GitHub's Copilot usage metrics API in the same week give administrators a clearer view of how Copilot is used beyond the editor. From 22 October, reports show the names of the skills, custom agents, MCP servers, slash commands and plugins an organisation builds, rather than lumping them together. From 23 October, a new totals_by_client array counts model traffic from tools such as OpenCode, Claude Code and Codex when they use Copilot as their model provider. Both are useful, and both come with caveats GitHub states plainly.
Named customisations
In September GitHub added agentic CLI metrics to the reports: arrays such as totals_by_skill, totals_by_custom_agent, totals_by_mcp, totals_by_slash_cmd and totals_by_plugin, each listing up to five items with the most recorded activity, with an interaction_count, plus distinct_*_use_count fields. At the time, GitHub showed names only for its own recognised items. "To protect privacy, customer-defined names are not shown," the September post said, and an organisation's own items appeared under other or custom.
The 22 October change reverses that. The same arrays now show the configured name of a customer-defined item. It applies in enterprise and organisation reports, including per-user 1-day and 28-day reports, aggregated 1-day reports, and the day_totals entries of aggregated 28-day reports. Each list now holds up to 25 entries per record, up from five, with any remaining activity in a trailing other entry. The counts themselves are calculated as before.
The limits matter for anyone planning to rely on this:
- Coverage. Names come from Copilot CLI (interactive and prompt mode), the GitHub Copilot app, Agent Client Protocol integrations such as JetBrains, and the Copilot SDK. Prompt mode, the app and ACP integrations need Copilot CLI 1.0.97 or later; the SDK needs v1.0.21 or later. IDEs report names only when their agent experiences run on that SDK version, and not from an IDE's built-in chat telemetry.
- Names as configured. Names are trimmed and cut at 128 characters. Names that look like file paths stay grouped under
otherorcustom. - Accuracy. The metrics come from client telemetry and can undercount, for example when clients are outdated or telemetry is blocked. GitHub's advice is to use them for trends and adoption, not exact accounting.
- History. Names appear only for report days processed after the release. Earlier days still show
otherorcustom.
GitHub also says to "review names before sharing reports outside your organization". That is good advice. A skill or MCP server name often describes an internal system, a customer or a project. A report that was safe to share in September may not be now.
Usage by client
The second change answers a different question: which tools send model requests through Copilot. Many developers now use Copilot as the model provider behind tools that aren't an editor, and those tools often send no editor telemetry, so their use was missing from totals_by_ide. The new totals_by_client array is counted on GitHub's side, from the requests themselves.
Each entry has a client (examples given include opencode, claude_code, codex, zed, copilot_cli, github_app, cloud_agent, code_review, vscode and jetbrains, with unrecognised ones under other), a request_count, a session_count, token usage, and a totals_by_model breakdown with a model_selection_mode of user_selected, auto or product_selected. Selection modes not yet reported individually appear as other, and values that can't be normalised as unknown. It is in enterprise, organisation, enterprise-user and organisation-user reports, 1-day and 28-day; in the aggregated 28-day reports it sits inside each day_totals entry.
GitHub's notes here are just as important:
- Requests are not prompts.
request_countcounts model calls, and one prompt can trigger several, so don't compare it directly with prompt or interaction counts. - Clients are self-identified. A client is recognised by the integration ID it sends. GitHub calls it "a best-effort grouping, not a verified identity". It is a usage signal, not a control.
- Code review and the cloud agent report
product_selected, because the product chooses the model, and code review's models appear asunknown. - It is additive. Existing fields are unchanged, and the array is empty when there is nothing to report.
GitHub also distinguishes this from agent app activity, which counts jobs started by agent apps on GitHub. totals_by_client measures model traffic, meaning requests and tokens, from any tool that uses Copilot.
Two sources, two kinds of error
The two changes rest on different data. Named customisations come from client telemetry, so they undercount when telemetry is missing. Per-client usage is counted on the server, so it catches tools that send no telemetry, but the client label depends on what each tool says it is. Neither replaces the other, so don't expect them to match. When you build a dashboard from both, label which is which.
Getting the reports
Both changes are in the existing reports from the usage metrics REST API, which returns signed download links to each day's report, or to the latest 28-day report, for an enterprise or organisation. Access is limited to enterprise owners and billing managers, organisation owners, and custom roles with the View Enterprise Copilot Metrics or View Organization Copilot Metrics permission, and the Copilot usage metrics policy must be enabled.
A practical way to start:
- Pull the latest 28-day organisation report and look at
totals_by_skill,totals_by_custom_agentandtotals_by_mcp(inside eachday_totalsentry) for items your teams built. Remember that only report days processed after the 22 October release carry names; the cut-off is when a day was processed, not its calendar date. - Compare the MCP server names with the servers you expect people to use. An unfamiliar name is a question to ask, not proof of a problem.
- Look at
totals_by_client, also inside eachday_totalsentry of the 28-day report, for tools you didn't know were in use, and at token volume per client before deciding which tools to support. - Check who can read the reports now that they contain internal names, and whether any automated export sends them outside the organisation.
Beyond one vendor's tools
These reports cover use that goes through Copilot. Teams that run several AI coding tools with different providers need the same questions answered across all of them. SpanDock's AI enablement report, on the Premium and Enterprise plans and in the 30-day trial, shows adoption by team, tag and tool, along with the MCP servers and tools used and the mix of models, built from the telemetry the SpanDock server already holds. It counts records by name and never reads prompt text.
Sources
- GitHub Changelog: Custom skills, agents, and MCP servers in usage metrics API (22 October 2026)
- GitHub Changelog: Usage metrics API adds usage from tools like OpenCode (23 October 2026)
- GitHub Changelog: Agentic CLI customizations now in the usage metrics API (17 September 2026)
- GitHub Docs: REST API endpoints for Copilot usage metrics