
Copilot usage metrics now flag missing telemetry and old clients
The Copilot usage metrics API now names users missing editor telemetry or running old IDE versions, and how to read those counts without double-counting.
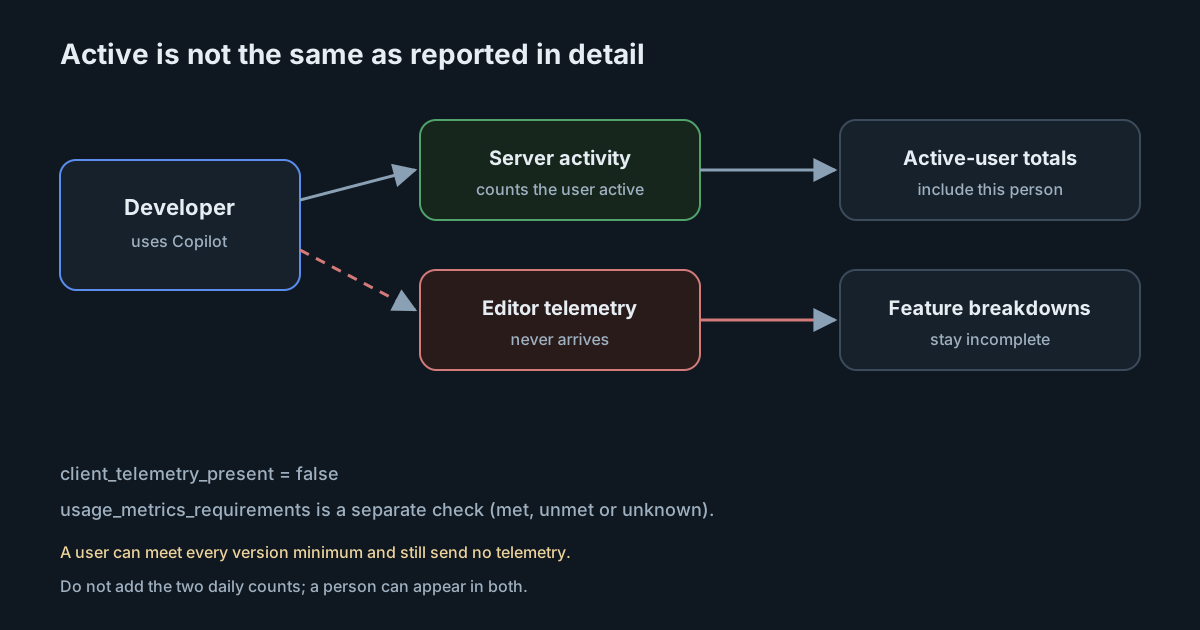
Copilot usage reports have a blind spot that is easy to misread as low adoption. A licensed developer can show up as active, consume requests, and still leave lines-of-code, feature and model breakdowns looking empty, because those details come from the editor and never arrived. On 5 November 2026 GitHub added fields that name that gap. The usage metrics API now tells you which users sent no client telemetry that day, and which ones are running an IDE or Copilot extension below the versions the reports support.
What landed on 5 November
The changelog adds four fields.
On each user record in enterprise and organisation user reports (both the 1-day and 28-day shapes):
client_telemetry_presentis whether qualifying client usage telemetry arrived for that user that day.falsemeans Copilot recorded the user's activity on the server, but no usage events arrived from their editor.usage_metrics_requirementslists each identifiable IDE and Copilot extension asmet,unmetorunknownagainst the minimum supported versions.
On aggregated enterprise and organisation reports:
missing_client_telemetry_user_countis how many users that day hadclient_telemetry_presentset tofalse.below_usage_metrics_minimum_user_countis how many users that day had at least one IDE or extension below the minimum.
The data reference and the example schema spell out the same fields in more detail. In 28-day user reports they describe that row's day, not the whole window. In 28-day aggregate reports the two counts sit inside each day_totals entry.
Access has not changed. The changelog says the fields are available to enterprise owners, enterprise billing managers, organisation owners, and anyone with a custom role that grants the View Copilot Metrics permission. The Copilot usage metrics policy must be enabled. The REST endpoints are the same report downloads as before; you read the new columns from those files rather than from a new route.
Why a user can be active and still look empty
The changelog's explanation is the part worth pinning to a dashboard. Users without client telemetry still count as active, but their reports lack detail such as lines of code, feature breakdowns and model breakdowns. Common causes it lists are outdated editors or extensions, disabled IDE telemetry, and proxies or firewalls that block events.
The docs add three distinctions that stop a careless query from inventing a crisis.
First, false and missing are not the same. The changelog says a null or omitted value means the data is unavailable, not false or zero. Days before this release have no values. The data reference repeats that 0 on a count is a measured zero, while null or omitted means the count is unavailable. The example schema says client_telemetry_present is null or omitted when telemetry status was not evaluated, including for users with only Copilot cloud agent or Copilot code review activity. Those users were never expected to send editor telemetry.
Second, the two signals are independent. A user can meet every version minimum and still have client_telemetry_present set to false, for example because they sit behind a proxy. The example schema makes the same point: usage_metrics_requirements can list vscode under unmet on a record where telemetry status is recorded separately.
Third, do not add the counts. The changelog is explicit: a user can appear in both missing_client_telemetry_user_count and below_usage_metrics_minimum_user_count, so adding them double-counts people. Do not add the daily counts across days either, because they are not unique-user totals. Enterprise counts are computed independently, not summed from organisations.
true is also not a clean bill of health. The data reference says true does not guarantee complete telemetry, and false does not say why telemetry is missing. These fields point you at people to follow up with. They are not a root-cause report.
This sits next to earlier expansions of the same API. We wrote about custom names for skills and counts for tools such as OpenCode when those breakdowns arrived. Those details are only as complete as the telemetry behind them. A report that now names your internal skills can still undercount the people whose editors never sent the events.
What the reports already knew, and what they did not
Active-user totals already mixed client-side and server-side signals. The data reference says users surfaced only through server-side telemetry are counted in active-user totals but may not appear in dimensional breakdown arrays such as totals_by_ide and totals_by_feature. Before these fields, that silence looked like a hole in the product. Now you can separate "we did not see this person" from "we saw them, and their editor said nothing."
That matters for anyone using the same reports to judge adoption phases, model mix or lines of code. Feature engagement and the richer breakdowns depend on client telemetry. If a tenth of your active users show client_telemetry_present: false, the model chart is a chart of the people whose editors reported, not of everyone who used Copilot. Capturing prompts in telemetry is a privacy decision is a different question; here the missing data is usage events, not prompt text. The operational problem is an incomplete picture of who did what, not a surprise collection of content.
What it means for engineering and security leaders
Use the new fields as a coverage check before you use the rest of the report as evidence. A weekly review that only looks at lines added, agent adoption or model mix should start by asking how many active users failed to send client telemetry that week, and how many ran a client below the minimum. If those numbers are large, fix coverage first.
Follow up with people, not with a support ticket, which is the changelog's stated point of the change. The per-user fields name who to talk to. The usual causes are an old editor, telemetry turned off in the IDE, or a proxy. Those are local configuration problems. They are also policy problems if your network defaults to blocking the endpoints usage metrics need.
Do not treat a missing-telemetry user as inactive, and do not treat them as a complete record either. They still count toward seats and active-user totals. They do not give you a trustworthy feature or model breakdown.
Keep the two counts separate in any slide you show. A bar labelled "users with reporting problems" that adds them together will overstate the number of people involved.
Practical takeaways
- Confirm the Copilot usage metrics policy is enabled, then pull the latest enterprise or organisation user report and the matching aggregate report from the REST API.
- Chart
missing_client_telemetry_user_countandbelow_usage_metrics_minimum_user_countas two series. Do not add them, and do not sum them across days. - Ignore nulls: days before 5 November will not have these fields, and a null is not a measured zero.
- For each user with
client_telemetry_present: false, checkusage_metrics_requirementsbefore you assume their editor is old. They may be on a current version behind a proxy. - Leave out users whose telemetry status was never evaluated, such as those with only cloud-agent or code-review activity that day.
- Until coverage is acceptable, treat feature, language and model breakdowns as lower bounds rather than as a census of Copilot use.
In SpanDock, process inventory (Enterprise plan, and in the 30-day trial) shows which AI tools run on your team's computers, including the ones that send no telemetry. It is off by default. While it is on, each computer sends the server a list of running processes, and you can choose to collect only AI tools or every process.