
OpenTelemetry's GenAI metrics changed in October: what breaks in your dashboards
The GenAI semantic conventions renamed inference and embeddings metrics and changed how failures and zero counts are recorded. What changed and how to adapt.
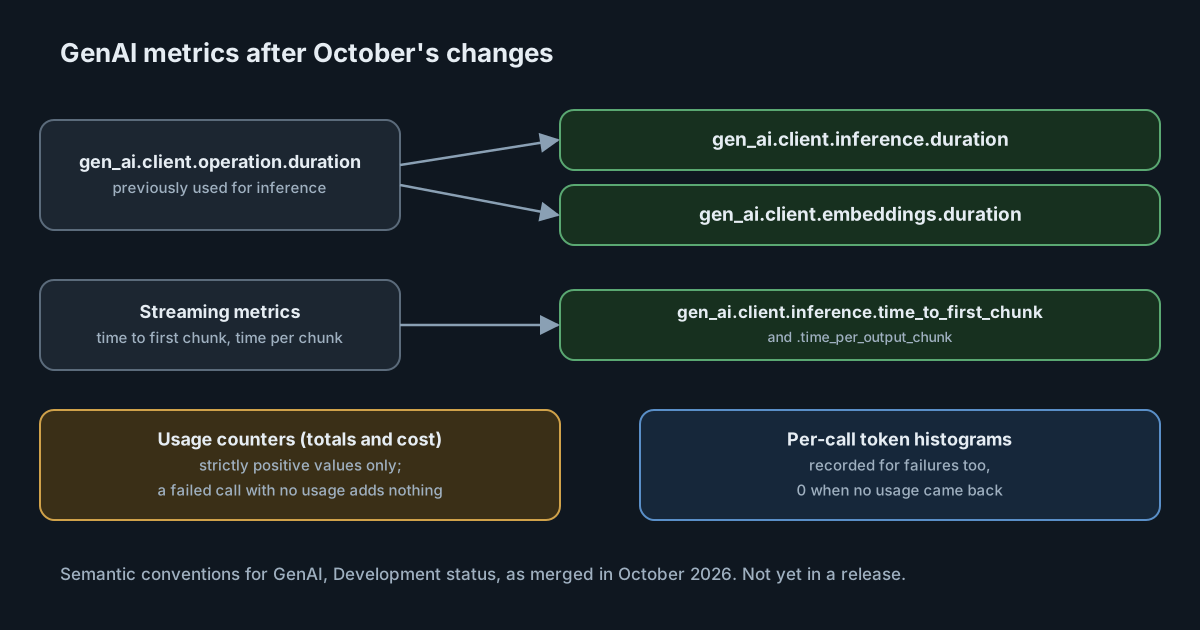
If your dashboards for AI tools are built on OpenTelemetry's generative AI conventions, October was a busy month. Between 6 and 27 October the GenAI semantic conventions repository merged two breaking metric changes, two changes to how failed calls and zero counts are recorded, and a run of smaller clarifications. None of it ships in a numbered release yet. But instrumentation libraries track the conventions, and the next time one of them updates, a latency panel can go quiet or a token panel can stop adding up.
This article covers what changed, why it matters for cost and latency reporting, and what to check.
Where the conventions stand
Some context first. The GenAI conventions used to live in OpenTelemetry's main semantic conventions repository. In version 1.42.0, released on 12 June 2026, every gen_ai.* attribute, metric, event and span there was deprecated and moved to a dedicated repository. The new repository has no tagged releases yet, and every signal in it is marked Development, the stage before stability. In practice, libraries implement whatever is on its main branch at the time they update.
That makes "which version are we on?" a harder question than usual. The useful answer is the date of the main-branch revision a library implements, and you'll usually find that in its changelog rather than in the telemetry.
The breaking changes
Inference has its own duration metric. Pull request #521, merged on 6 October, introduced gen_ai.client.inference.duration. The general gen_ai.client.operation.duration metric now says it SHOULD NOT be reported for inference or embeddings. The two streaming metrics moved with it and are now gen_ai.client.inference.time_to_first_chunk and gen_ai.client.inference.time_per_output_chunk. The client inference page defines the new duration as the time from issuing the request to receiving the full response, or to the error or cancellation, and says it should match the span's duration when both are reported.
If a latency panel queries gen_ai.client.operation.duration, it will empty as libraries pick this up.
Embeddings have their own metrics. Pull request #578, merged on 26 October, moved embeddings to gen_ai.client.embeddings.duration and gen_ai.client.embeddings.operation.input_tokens. Embeddings no longer report through the general metrics, and the token metrics page says total embedding token usage can be computed from the new histogram.
Together, these two changes split one shared duration metric into one per kind of operation. That is cleaner to query, but any panel or alert that relied on the shared name needs rewriting.
How tokens are counted now
The token model was already reworked in September: the old gen_ai.client.token.usage histogram and its gen_ai.token.type attribute were replaced by two families, which the token metrics page describes this way:
- Usage counters,
gen_ai.client.inference.usage.*: five monotonic counters for input, output, cache-read input, cache-write input and reasoning output tokens, broken down bygen_ai.token.modality. These are the instruments for totals, spending rate and cost approximation. The cache and reasoning counters are subsets of the input and output counters, so adding all five double-counts. - Per-operation histograms,
gen_ai.client.inference.operation.input_tokensand.output_tokens: one value per call, for percentiles and outliers. The page says plainly that they "should not be used for total usage or cost calculations", and they are deliberately not broken down by modality, because percentiles across modalities don't add up.
October refined how both families treat failures, and they now behave differently, which is easy to miss:
- Pull request #536 (9 October) asks for the histograms to be recorded for failed operations too, with
error.type, and with0when no response or no usage came back. - Pull request #602 (21 October) says the usage counters should record contributions from failed operations as well, but each measurement must be a known, strictly positive value. A failed call with no usage adds nothing to a counter. When the modality can't be determined, it is recorded as
unknown.
So a failed call now appears as a zero in the per-call histogram and not at all in the totals. For latency and error dashboards that is useful: failures are visible in the distribution. For cost it means failed calls only add to spend when the provider reported usage for them. The page also says that when a provider reports both used and billable tokens, instrumentation must report billable ones.
A related change, pull request #548 (17 October), makes the cache, reasoning and modality breakdown attributes recommended only when they are available and non-zero. Expect fewer zero-valued attributes on spans, and don't treat an absent cache attribute as "no caching configured".
Smaller changes worth knowing
- The inference details event is now recommended.
gen_ai.client.inference.operation.detailsmoved from opt-in to recommended in pull request #579. Check what your libraries put in it before more of them start emitting it by default, especially if content capture is configured. - Tool call IDs.
gen_ai.tool.call.idis conditionally required on tool execution spans when the provider supplied an ID. - MCP. Error recording on MCP spans was clarified, and transport details were removed from MCP session-duration metrics.
- New areas. Conventions for the A2A protocol and for referencing content stored outside the telemetry were merged on 27 October.
The conventions are still settling. In the current text, the note on gen_ai.invoke_workflow.duration still points single model calls to gen_ai.client.operation.duration, which the inference change says not to use for inference. Expect follow-up edits.
What it means for engineering and security leaders
Most organisations don't instrument AI tools themselves: Claude Code, Codex and others emit their own telemetry, and SDK instrumentation libraries cover in-house applications. The conventions reach you through those libraries' release cycles, at different times. For a while you will receive old and new metric names side by side, from different tools or different versions of the same tool.
Two consequences follow. Cost reports should be built on the usage counters, not on histogram sums, and should be checked against provider invoices, because the conventions approximate cost rather than reproduce billing. And any alert keyed to a metric name needs an owner who reads library changelogs, because a renamed metric produces silence rather than an error.
Practical takeaways
- Inventory your queries. Search dashboards and alerts for
gen_ai.client.operation.duration,gen_ai.client.token.usageandgen_ai.token.type. Each is a candidate for breaking. - Query both names during the transition. Use
gen_ai.client.inference.durationalongside the old metric until every source has moved. - Totals from counters, percentiles from histograms. Don't sum the histograms for cost, and don't add the cache and reasoning counters to the input and output counters.
- Expect zeros in histograms. Failed calls with no usage now record
0. Filter byerror.typewhen you want percentiles for successful calls only. - Pin and record. Note which revision of the conventions each library implements, and treat its updates as schema changes.
For the broader picture, see our guides to OpenTelemetry for AI coding tools and to tracing the Claude API with OpenTelemetry.
SpanDock receives OpenTelemetry from AI tools and forwards it to the backends you choose with the original bytes the tool sent, as the destinations documentation describes. That means it doesn't rename metrics on the way through: when a tool moves to the new names, your backend receives the new names, so the dashboard and alert review above still applies.
Sources
- OpenTelemetry semantic conventions for generative AI (repository)
- GenAI semantic conventions: client inference spans and metrics
- GenAI semantic conventions: token metrics
- Pull request #521: use gen_ai.client.inference.duration for inference
- Pull request #578: dedicated metrics for embeddings
- Pull request #602: record only positive inference usage contributions
- Pull request #536: record token usage histograms for failed operations
- Pull request #548: recommend optional token usage attributes only when non-zero
- Pull request #579: inference operation details event recommended
- OpenTelemetry semantic conventions v1.42.0 release notes